 By Joy Ndamukunda
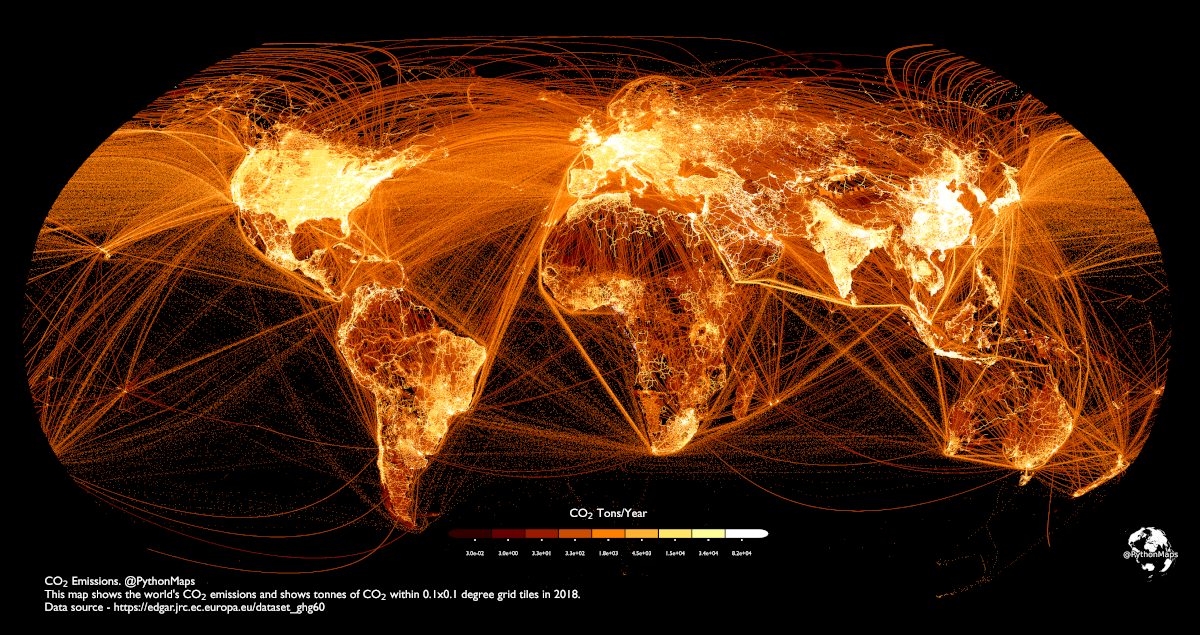
This is a map of carbon emissions around the world, made by Adam Symington. An estimated 37.4 billion metric tons of carbon dioxide (CO2) are emitted annually by the world’s population.
Using data from the European Commission for 2018, this map shows carbon emissions worldwide in tons of CO2 per 0.1-degree grid (about 11 square kilometers).
This map shows that China and India, the two most populous nations and major economic powers, both produce significant quantities of CO2. China alone is responsible for over 27% of the world’s CO2 emissions.
With numerous shipping lanes east of China and the main Indian Ocean highway between the Strait of Malacca and the Suez Canal clearly shown, we can also understand how much shipping contributes to emissions when we look at the oceans.
Furthermore, the US is among the top carbon polluters in the world. Although the emissions per capita of several other countries, such as Saudi Arabia and Qatar, are higher, their overall emissions are lower because of their smaller populations. Major population hubs such as the Boston-Washington corridor, the Bay Area, and the Great Lakes have the brightest lighting in the United States. Even in the sparsely populated middle of the nation, many of the interconnecting routes that connect all these major centers are likewise illuminated. Because there is so much maritime and aircraft traffic into and out of the United States, the waters have become a murky mixture.
The main populated area surrounding Mexico City and the traffic moving through the area may be seen to the south. Similar to other regions, in South America, some of the most populous cities—such as Rio de Janeiro and São Paulo in Brazil and Buenos Aires in Argentina—are also top emitters. This map also shows the challenging terrain of the continent, with most people and car emissions concentrated along the shore. But there are other significant emitters in the area besides the cities. In several places, notably the major city of Manaus on the Amazon River, there are distinct boundaries where highways and cities have been built, cutting through the Amazon forest. Similarly, numerous important shipping channels are marked in the oceans, especially to the east of Brazil.
Moreover, Germany is one of the major carbon emitters in Europe; its CO2 emissions in 2021 came to approximately 644 million metric tons. Together with the UK, Italy—which emits CO2 at a rate second only to Germany—and the substantial volume of trade that occurs across the English Channel are also having an impact.
Northern Africa’s lines of activity across the Mediterranean are far clearer and simpler than the complex web of cities, towns, and busy highways that crisscross Europe. There are two notable exceptions in the Middle East: Israel and Egypt’s Nile River and Suez Canal, which are both heavily illuminated.
In conclusion, as global emissions continue to increase, maps like these are useful for monitoring ongoing changes and their sources.
Sources:
Mapped: Carbon Dioxide Emissions Around the World
https://www.epa.gov/ghgemissions/sources-greenhouse-gas-emissions